Generated by jupyter2hashnode using a Jupyter Notebook
Example notebook
#codepython
import pandas as pd
import matplotlib.pyplot as plt
#codepython
data = {
    'fruits' : ['apple', 'blueberry', 'cherry', 'orange'],
    'counts' : [40, 100, 30, 55],
    'bar_labels' : ['yellow', 'blue', 'red', 'orange'],
    'bar_colors' : ['yellow', 'blue', 'red', 'orange']
}

df = pd.DataFrame(data)
#codepython
df
| fruits | counts | bar_labels | bar_colors | |
| 0 | apple | 40 | yellow | yellow |
| 1 | blueberry | 100 | blue | blue |
| 2 | cherry | 30 | red | red |
| 3 | orange | 55 | orange | orange |
#codepython
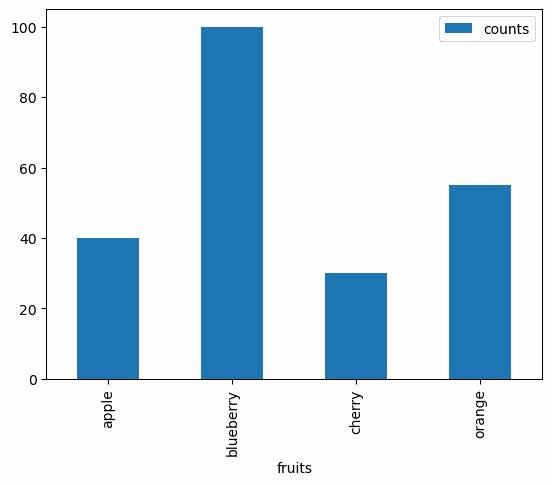
df.plot.bar(x="fruits", y="counts" )
[output:]
<AxesSubplot:xlabel='fruits'>

#codepython
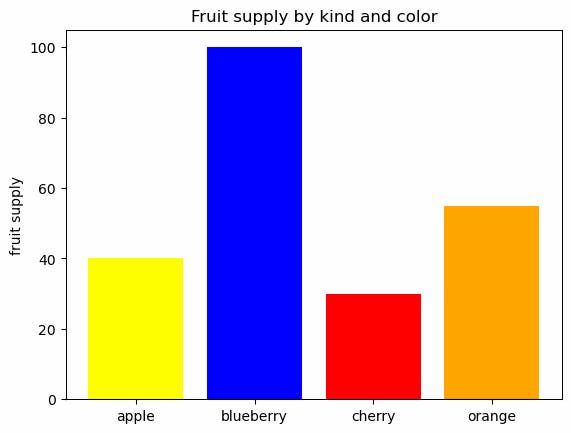
fig, ax = plt.subplots()


ax.bar(df.fruits, df.counts, label=df.bar_labels, color=df.bar_colors)

ax.set_ylabel('fruit supply')
ax.set_title('Fruit supply by kind and color')


plt.show()

